
| Usage share of desktop browsers for June 2013 |
||||||
| Source | Chrome | Internet Explorer |
Firefox | Safari | Opera | Other |
| StatCounter | 42.68% | 25.44% | 20.01% | 8.39% | 1.03% | 2.44% |
|---|---|---|---|---|---|---|
| Clicky | 38.92% | 29.08% | 21.22% | 9.28% | 1.17% | 0.32% |
| W3Counter | 32.60% | 21.70% | 19.50% | 15.40% | 2.20% | 8.60% |
| NetApplications | 17.17% | 56.15% | 19.15% | 5.55% | 1.58% | 0.40% |
| Wikimedia | 46.02% | 20.47% | 17.71% | 3.10% | 5.45% | 7.25% |
The following table is taken from Wikipedia. What this reviewer would like Net Applications to explain is how they get their numbers and why are they so far off the rest of the reviewers? Wikipedia notes “Net Applications bases its usage share on statistics from 40,000 websites having around 160 million unique visitors per month. The mean site has 1300 unique visitors per day.On 1 August 2009, Net Applications began weighting its raw data based on the number of internet users in the countries concerned, using data from the CIA ; the changes were applied retroactively to older data, starting with November 2007“.
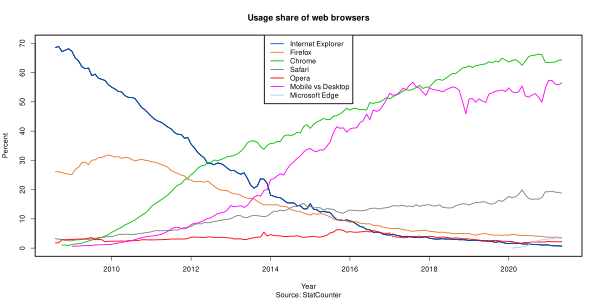
In the meantime two other factors point to continuing problems for Internet Explorer. First, mobile browser usage is growing fast and IE except for Windows Phone OS [less than 3% world market share] is a very minor player in the increasing mobile usage:
The second problem for IE is that it continues to trail in the latest Web technology – HTML5:

So Microsoft’s steadfast defiance of the Web and things mobile has come home to roost. Another Microsoft monopoly position has fallen to the wayside. In this case, it is a great gain for end users and Web developers because IE and Microsoft since roughly 2001 have been major impediments to Web progress and success.